Bocada Cloud connects to Zerto Virtual Manager (ZVM) to collect backup activity and/or Disaster Recovery (DR) information for monitoring, reporting and alerting.
The Zerto connector supports Windows-hosted ZVM and Linux-based ZVM/Zerto Cloud Appliance (ZCA) environments. As Zerto is an installed application, Bocada Cloud uses the Bocada Cloud Data Collection Agent to collect information from your private network.
Note: Disaster Recovery monitoring and reporting is only available with the Ultimate subscription plan.
Table of Contents
- Confirm the Zerto prerequisites
- Add a Zerto connection
- Install or select the Data Collection Agent
- Configure Zerto system details and data collection
- Configure the RPO/SLA tolerance window
- View Zerto Disaster Recovery reports
- Monitor DR Health on a Dashboard
- Configure Zerto DR alerts by email or ticket
- Troubleshooting
1. Confirm the Zerto prerequisites
Before creating the Zerto connection, confirm that you have:
- The hostname or IP address of the Zerto Virtual Manager (ZVM) you want to monitor.
- A Zerto username with read-only access to the ZVM REST API and its password.
- A Windows or Linux machine where ZVM and the Bocada Cloud Data Collection Agent will be installed. You can also install the Bocada Cloud Data Collection agent on a Windows or Linux machine in the same private network that can reach your ZVM.
- Network access from the Bocada Cloud Data Collection Agent agent to the ZVM REST API. The default Zerto port shown in the connector is 9669.
- Outbound access from the Bocada Cloud Data Collection agent to
backup-api.cloud.bocada.com on port 443.
The machine where the Bocada Cloud Data Collection Agent is installed must remain running to support ongoing data collection. For supported operating systems, installation requirements, and network configuration, see What is the Bocada Cloud Data Collection Agent and how does it work?
2. Add a Zerto connection in Bocada Cloud
- Log into Bocada Cloud.
- In the left navigation menu, select Connections, then +Add.
- Search for Zerto and select the Zerto application tile.
- Choose whether to Use an existing agent or Install a new agent.
- Select Next to continue through the connection wizard.
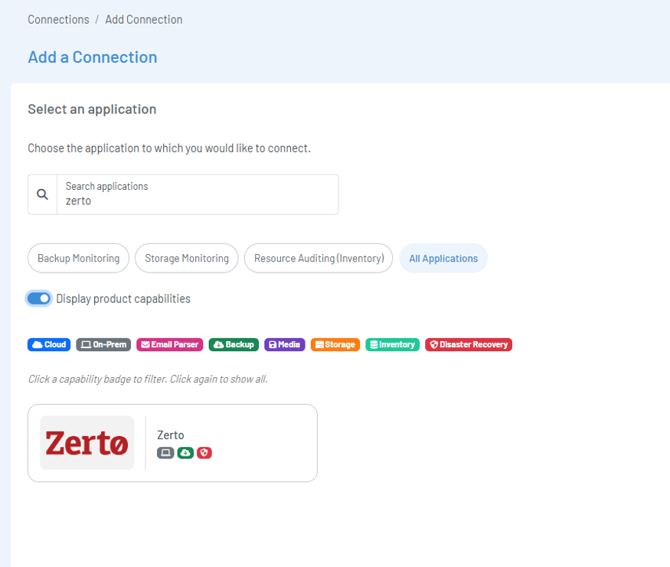
Select the Zerto application
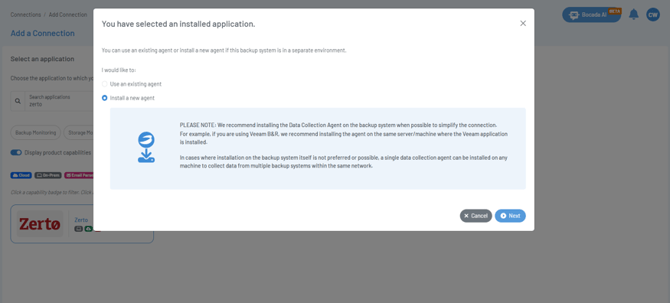
Choose an existing or new Data Collection Agent
3. Install or select the Data Collection Agent
The Bocadad Cloud Data Collection Agent communicates with the ZVM inside your network and sends collected data to Bocada Cloud. One agent can collect data from multiple supported systems on the same network.
If you are using an existing registered Bocada Cloud Data Collection Agent, select it in the connection wizard and continue to the connection details page.
To install a new agent:
- Choose the applicable installer for Windows, Linux (DEB), or Linux (RPM).
- Enter a descriptive Data Collection Agent Name.
- Download and install the agent on a machine that can communicate with the ZVM.
- Copy the Agent Authentication Key provided by Bocada Cloud and use it to register the agent.
- Select Test Connection to verify communication with Bocada Cloud.
- When the test succeeds, select Next.
Note: Keep the Agent Authentication Key secure. For complete installation and troubleshooting instructions, refer to the Data Collection Agent KB article.
4. Configure Zerto system details and data collection
Connection Details
Complete the fields that identify and organize the connection in Bocada Cloud:
- Data Collection Agent: Select the agent that can communicate with Zerto.
- Organization: Select the Organization that will own the collected data.
- Connection Name: Enter a descriptive name that will be displayed in reports. We recommend including the ZVM hostname or site for easy identification.
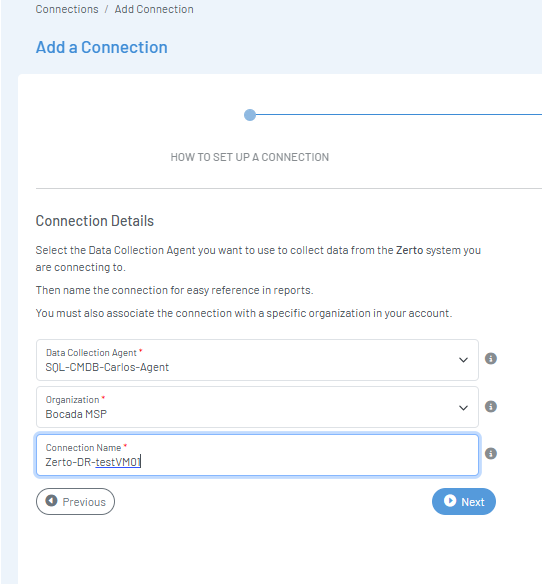
Identify the connection and Organization
Zerto System Details
On the Provide Zerto System Details screen, enter:
- Backup Data Source: Select Windows ZVM or the applicable Linux-based ZVM/ZCA option.
- Hostname or IP Address: Enter the ZVM address accessible from the agent.
- Username: Enter the Zerto username with read-only access to the ZVM REST API.
- Password: Enter the password for that user.
- Time Zone: Select the time zone where the Zerto system resides.
Optionally, enable Set Password expiration date and specify when the credentials will expire. You can then configure a notification or ticket trigger before expiration to help prevent data collection failures.
You can change these selections later by editing the connection.
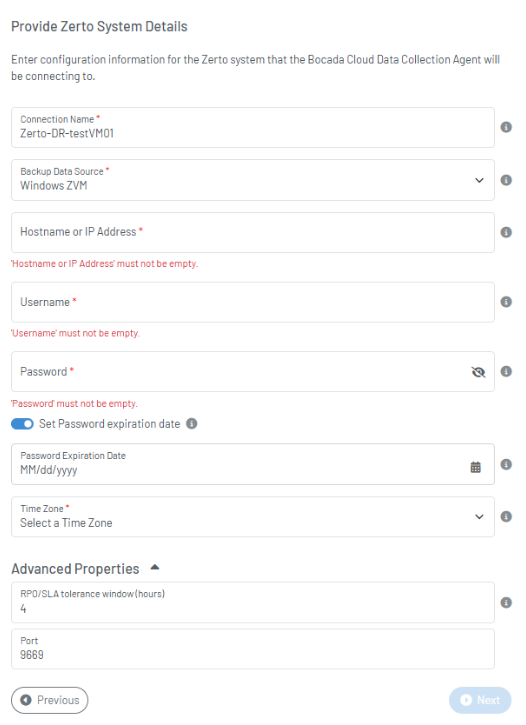
Zerto system settings
Under Data to collect, make sure both collection types are enabled:
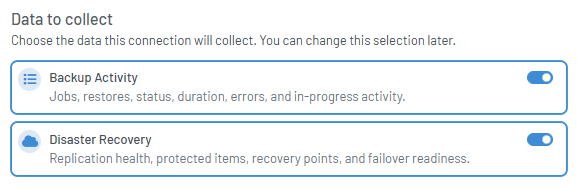
Complete the wizard to connect to Zerto and begin initial data collection.
5. Configure the RPO/SLA tolerance window
In the connection's Advanced Properties, the RPO/SLA tolerance window (hours) specifies how long a DR health issue can persist before it affects the daily status in the DR Trends report.
For example, if the tolerance window is set to 4 hours, an issue that persists beyond four hours may cause that day's status to be marked for review. Short-lived conditions can be distinguished from sustained issues.
To configure this setting:
- Open the Zerto connection settings.
- Expand Advanced Properties.
- Set RPO/SLA tolerance window (hours) to the desired value.
- Review the Port setting (default 9669) and save the connection.
Note: The RPO/SLA tolerance window in Bocada Cloud is not the same as the RPO configured in Zerto. The Zerto RPO concerns the age of recoverable data; the Bocada tolerance window concerns how long a DR issue can persist before affecting the reported daily health assessment.
6. View Zerto Disaster Recovery reports
Once DR data collection has completed, open Reports > Reports Library to access three standard DR reports. They are designed to answer different questions about the protection and recovery of your workloads.
DR Protected Assets — What is protected and how healthy is it?
The DR Protected Assets report lists protected workloads and shows their current replication and recovery health. Available fields include the protected asset, Organization, Connection, product, vault or site, replication policy, protection group, protected size, health, health driver, failover health and readiness, and RPO information.
This report helps you locate workloads with warnings, assess their failover readiness, and understand which protection group or policy is associated with an issue.

DR Protected Assets report
Expand an asset or open its details to review the available health evidence, recent recovery activities, and recovery points.
DR Recovery Activity — What happened, and what was the result?
The DR Recovery Activity report displays recovery-related operations and events collected from Zerto. Summary counters show total activities, failed and successful activities, validation activities, recovery executions, and the number of affected protected assets for the selected period.
The report grid includes activity type, affected asset, Organization, Connection, category, status, start and end times, duration, and result. Depending on the Zerto data available, activities can include alerts, test failovers, failovers, and other recovery operations.
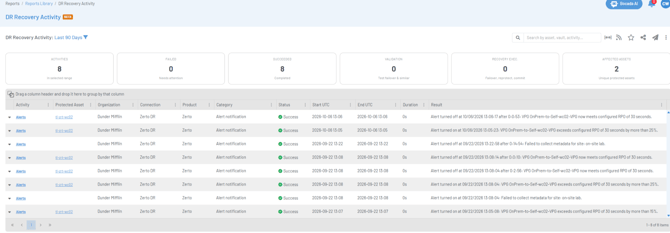
DR Recovery Activity report
To investigate an activity, select the arrow beside its row to expand the execution timeline and result. Select See more to open the full activity detail, including available identifiers and the related protected asset.
Important: An activity marked Success indicates that the recorded activity completed successfully. For example, a successful Zerto alert notification may still indicate that a VPG exceeded its configured RPO. Use the Protected Assets and Trends reports to assess protection health.
DR Trends — How has DR health changed over time?
The DR Trends report shows daily health assessments for protected assets. You can expand the hierarchy by Organization > Connection > Protected Asset to compare workloads and identify persistent or recurring issues.
For example, a green Ready cell represents a clean posture for the selected day, while a yellow Review cell signals that something requires attention. The detailed view explains the relevant issue and may identify it as a Warning.
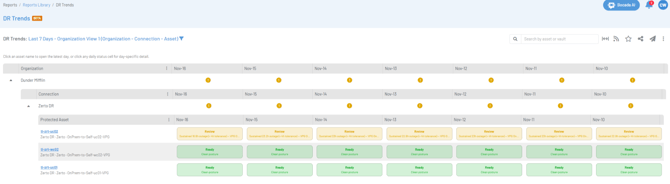
Daily asset status in DR Trends
To investigate a particular day, select its status cell. The details explain the daily assessment and, when available, show the duration of the issue, RPO and evaluation timestamps, failover health and readiness, recent activities, and recovery points. Selecting a protected asset name opens the asset's latest available health information.
For example, a VPG that is overdue for failover testing may be flagged even when replication recovery points are available. The report helps distinguish RPO conditions from other readiness concerns.
Customize Disaster Recovery reports
Use the Criteria filter (funnel icon) in a DR report to select the Organizations, Backup Products, Connections, and Date Range to include. Some reports also provide Advanced Filters.
Grid-based reports support adjusting columns, sorting, and grouping to help focus on a particular customer, site, protection group, or issue. To keep your preferred configuration, open the report's three-dot menu and select Save as a new report.
For detailed instructions, see How do I configure or customize a report?
7. Monitor DR Health on a Dashboard
The DR Health widget provides an at-a-glance view of Disaster Recovery health directly on a Bocada Cloud Dashboard. It complements the three DR reports by highlighting which protection groups may need attention without first opening the Reports Library.
When Count By is set to Protection Groups, the widget summarizes the number of protection groups classified as Critical, Warning, Healthy, or N/A. Select View Report below a status to investigate the associated DR information.
The Needs Attention panel identifies protection groups with issues, shows the reported condition, and indicates when that condition was last observed. The panel also displays when observations may be considered stale.
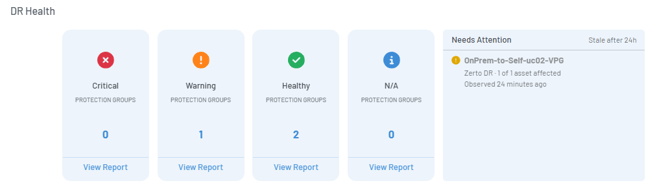
DR Health widget showing protection group health and Needs Attention
To configure the DR Health widget:
- Open the Dashboard containing the DR Health widget.
- Open the Dashboard menu (three-dot icon) and select Configure Widgets.
- Under DR Health, set Period (Days) and choose the Count By option. The example shown counts Protection Groups over 7 days.
- Save your Dashboard changes.
Note: Dashboard widget availability and configuration depend on your subscription plan and user permissions. For more information, see How do I customize Dashboards in Bocada Cloud?
8. Configure Zerto DR alerts by email or ticket
Bocada Cloud can notify you when a Zerto protection group remains out of sync with its RPO or journal history SLA longer than a configured duration. The Zerto Disaster Recovery Out of Sync trigger supports both Email Notification and Ticket-based alerts.
To create an alert:
- From the left navigation menu, select Administration > Alerting > Add Alert.
- Choose Email Notification to notify recipients by email, or Ticket to create a ticket through a configured integration.
- For a Ticket alert, select an existing ticketing integration or configure a new one.
- Under Trigger Type, select Zerto Disaster Recovery Out of Sync.
- Under Trigger Settings, enter the number of hours in Out of sync for (hours).
- Select Next and follow the wizard to set the alert Scope, Grouping, and delivery details. For an email alert, configure the recipients and message settings as prompted.
- Review the configuration and save the alert.
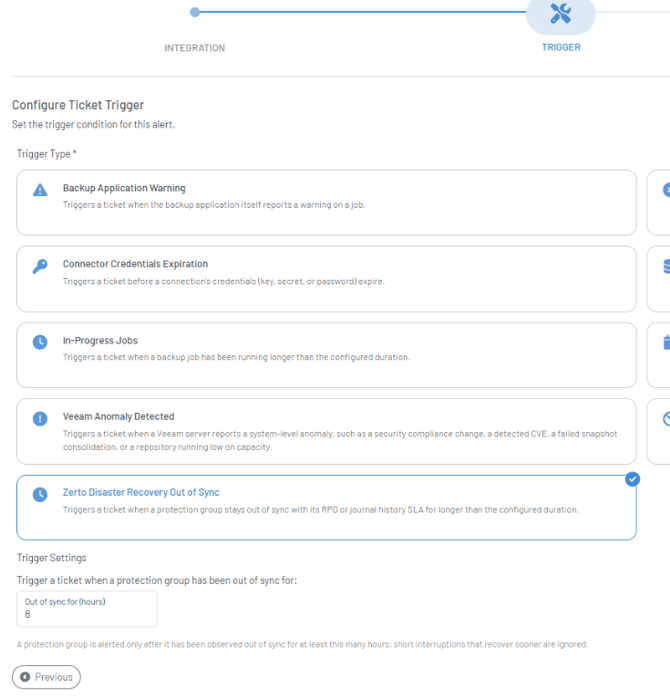 Zerto Disaster Recovery Out of Sync trigger
For example, an 8-hour threshold means a protection group must be observed out of sync for at least eight hours before the alert is triggered. Short interruptions that recover sooner are ignored.
Note: This alert threshold is configured independently of the connection's RPO/SLA tolerance window. One setting affects the DR Trends daily assessment; the other controls when an out-of-sync alert is generated.
Manage saved alerts under Administration > Alerting > List Alerts. For guidance on selecting recipients, ticket integrations, scope, grouping, and testing alerts, see What alerts can I set up in Bocada Cloud? and Can I automatically open tickets in my ticketing system when a backup fails?
10. What should I check if Zerto data is not displayed?
If the Zerto connection fails or information does not appear in the reports, confirm that:
- The Data Collection Agent is installed, registered, and communicating with Bocada Cloud.
- The agent can reach the ZVM hostname or IP address over the configured REST API port.
- The correct Data Source (Windows ZVM or Linux-based ZVM/ZCA) is selected.
- The REST API username and password are correct and the account has the required read access.
- The time zone configured for the connection matches the Zerto server’s operating system time zone.
- The required Disaster Recovery and Backup Activity data collection options are enabled on the connection.
- Initial data collection has completed.
- The report Criteria include the relevant Organization, Connection, product, and reporting period.
For a missing recovery event, also confirm that the activity exists in Zerto and falls within the selected Date Range. If an alert does not trigger, review its scope and Out of sync for (hours) value.
If you have any questions about setting up the Zerto connection or the data in reports, create a Support Ticket in Bocada Cloud, or contact us.