
Bocada Cloud dashboards provide a configurable view of backup health, activity, resources, alerts, storage and other information relevant to your environment. The dashboard is a visual collection of data elements (graphs, charts, reports) called “widgets” that enable you to see the most important information in one place, on one screen. From a dashboard, you can quickly navigate and dive deeper into a specific data item to see more.
Depending on your Bocada Cloud subscription plan and user role, you can customize the data displayed on a Dashboard, configure individual widgets, rearrange the Dashboard layout, create additional Dashboards, and publish Dashboards for other users.
Table of Contents
1. Understand the Main Dashboard and custom Dashboards
2. Dashboard features by subscription plan and user role
3. Select a Dashboard
4. Filter Dashboard data using Criteria
5. Configure Dashboard widgets
6. Show or hide Dashboard widgets
7. Configure widget drill-down reports
8. Save changes made to the Main Dashboard
9. Save an existing custom Dashboard as a new Dashboard
10. Edit Dashboard properties
11. Select your default Dashboard
12. Publish a Company-wide Dashboard
13. Troubleshooting
1. Understand the Main Dashboard vs. Custom Dashboards
The Main Dashboard is the standard Dashboard provided and maintained by Bocada.
The Main Dashboard can be used as a starting point for creating your own Custom Dashboard, similar to the way a Standard Report can be configured and saved as a Custom Report. Users with Dashboard configuration permissions can:
- Filter the data by editing Dashboard criteria
- Configure widgets to display data in different ways
- Rearrange and resize widgets
- Show or hide widgets
Changes cannot be saved directly to the Main Dashboard which is a standard layout managed by Bocada. However, you can make changes to the Main Dashboard and save it as a personal Custom Dashboard with a specific name.
Note: Bocada Cloud does not automatically create Organization-specific Dashboards as it did prior to the August 2026 release. Instead, users with appropriate permissions can create custom Organization-specific dashboards of their own.
Note: Users only see Dashboard data from Organization(s) they have been given permission to access through their role.
2. Dashboard features by subscription plan and user role
Available Dashboard customization features depend on your Bocada Cloud subscription plan:
|
Configuration option |
Standard |
Pro |
Ultimate |
|
Filter by Organization, Backup Product, and Connection |
Yes |
Yes |
Yes |
|
Configure supported widgets |
Yes |
Yes |
Yes |
|
Rearrange and resize widgets |
Yes |
Yes |
Yes |
|
Create a personal custom Dashboard |
1 |
Unlimited |
Unlimited |
|
Select a personal default Dashboard |
Yes |
Yes |
Yes |
|
Show or hide widgets |
No |
Yes |
Yes |
|
Create multiple custom Dashboards |
No |
Yes |
Yes |
|
Select custom drill-down reports |
No |
No |
Yes |
|
Publish Company-wide Dashboards |
No |
No |
Super Admins only |
|
Set a Company-wide default Dashboard |
No |
No |
Super Admins only |
Dashboard editing is available to Super Administrators, Organization Administrators, and Editors, subject to the capabilities included in their subscription plan.
Viewers cannot edit Dashboard layouts, configure widgets, or create personal Dashboards.
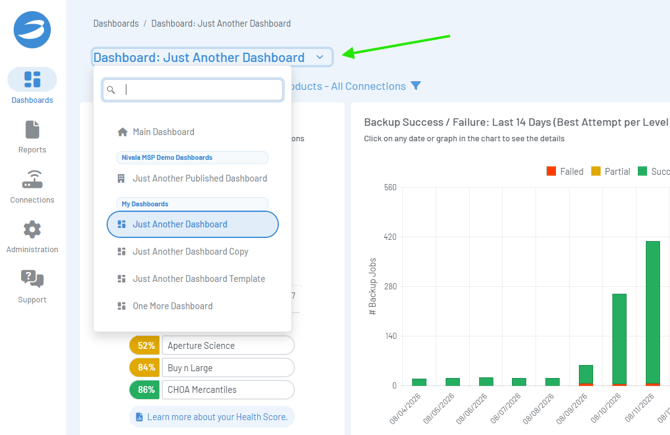
3. Select a Dashboard
To open a Dashboard:
- In Bocada Cloud’s left navigation menu, select Dashboards.
- Select the Dashboard name at the top of the page.
- Choose a Dashboard from the list.
Depending on your access, the list may include:
- Main Dashboard
- Company-wide Dashboards available to every user in your account
- Personal Dashboards under My Dashboards
You can use the search field at the top of the Dashboard selector to locate a Dashboard when multiple Dashboards are available.
4. Filter Dashboard data using Criteria
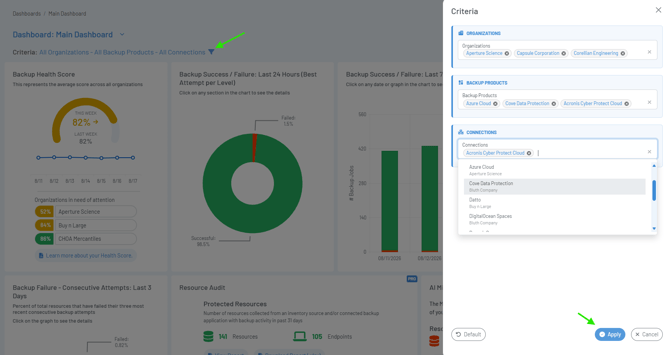
Dashboard Criteria determine what data is displayed in the Dashboard.
You can filter a Dashboard by:
- Organizations
- Backup Products
- Connections
Multiple values can be selected when configuring Dashboard Criteria.
To change the Criteria:
- Open the Dashboard you want to view or configure.
- Select the filter icon beside Criteria.
- Select the Organizations, Backup Products, and Connections you want to include
- Select Apply.
The Criteria displayed at the top of the Dashboard update to reflect your selections.
If no specific Criteria are selected, the Dashboard displays data using all Organizations, Backup Products, and Connections available to you.
Select Default in the bottom left of the Criteria panel to restore the default selections.
Note: Dashboard Criteria do not grant access to additional data a user does not have access to through their user role. Users can only select and view Organizations and related data that they already have been given permission to access.
5. Configure Dashboard widgets
Many Dashboard widgets can be configured independently.
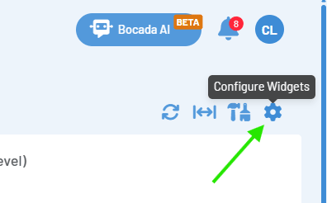
To configure widgets:
- Open the Dashboard.
- Select Configure Widgets from the Dashboard toolbar.
- Configure the available options for each widget.
- Save your changes when finished.
Configuration options vary by widget and may include:
Period
Select the period to be used by the widget. Depending on the widget, options may include:
- 24 Hours
- N-Days
- Include Tags
- Exclude Tags
When N-Days is selected, enter the number of days the widget should include.
For example, the Backup Success / Failure widgets can be configured to display data from the past 24 hours or a period of up to 15 days.
Attempts
Some backup activity widgets allow you to determine whether the widget displays the data by "Best Attempt" or "All Attempts," similar to Reports. By default, "Best Attempt" is used to show the best backup result for each resource for that day.
Tags
Some widgets can use resource tags to further control which data is displayed. You can configure a widget to Include or Exclude specific tags.
Drill-down Report
Backup success/failure widgets can be configured to open a specific report when you click the chart/graph to see more detailed "drill-down" data. In this way, a user can use a standard or saved custom report they have already configured so that the data is in a format of their choosing (specific columns, column order, sorted / filtered / grouped, etc.).
This capability is available with the Ultimate plan. See the Configure widget drill-down reports section below for more information.
Some widgets do not have configurable properties. When a widget does not support configuration, Bocada Cloud displays: No configuration is available for this widget.
6. Show or hide Dashboard widgets
Pro and Ultimate users can choose which widgets are displayed on a Dashboard.
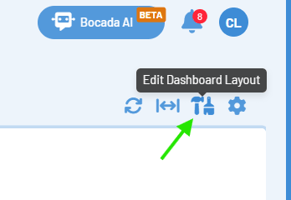
To show or hide widgets:
- Click the Edit Dashboard Layout icon (hammer/paintbrush graphics)
- Click the Show/Hide Widgets icon (eye graphic).
- Use the toggle beside a widget to show or hide it.
- Save your Dashboard changes.
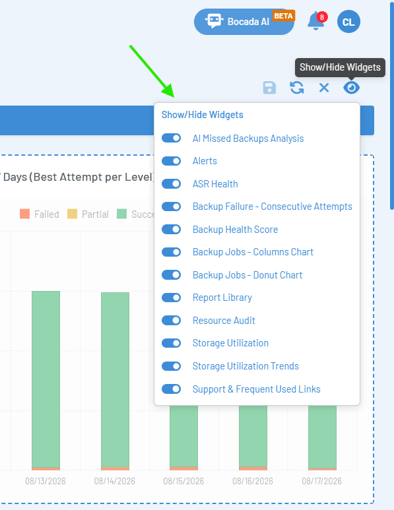
Hiding a widget removes it from the Dashboard layout but does not delete the underlying data or report.
You can return to the Show/Hide Widgets menu at any time to re-enable a hidden widget.
7. Configure widget drill-down reports
With the Ultimate plan, the Backup Success / Failure widgets can be configured so that when a user clicks on the graph/chart, it will open either a standard or custom saved report that is based on the Job Activity or Job Trends standard report template to drill into the data.
To configure a drill-down report:
-
- Open the Dashboard.
- Click the Configure Widgets icon (gear graphic)
- Select a Backup activity widget that supports a drill-down report option
- Under the Drill-down Report section, choose either:
- Default report
- Custom selected report
-
- If you select Custom selected report, choose an available report that was created using the Job Activity or Job Trends report template.
- Save the Dashboard configuration.
The selected report is opened when you click on the chart/graph in the Dashboard widget.
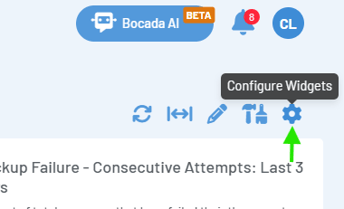
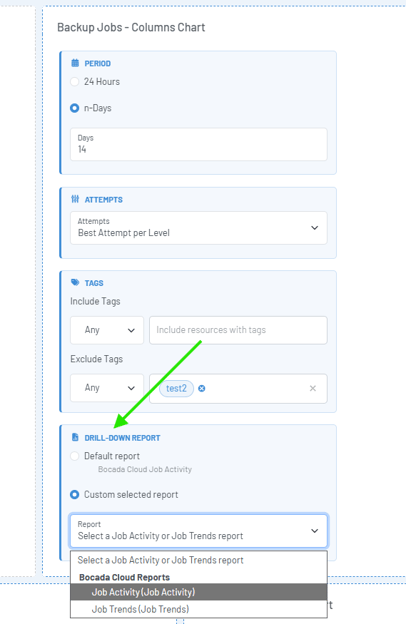
Note: Users can only select custom reports that they have permission to access.
8. Save changes made to the Main Dashboard
The Bocada Main Dashboard cannot be overwritten by an individual user.
If you configure the Main Dashboard by changing its Criteria, widget configuration, or layout, save those changes as a personal custom Dashboard.
Your new Dashboard can include:
- Dashboard Criteria
- Widget placement and size
- Widget visibility
- Widget configuration
- Configured drill-down reports
The Main Dashboard will remain unchanged.
Standard subscription plan users can maintain one personal custom Dashboard.
Pro and Ultimate subscription plan users can create multiple custom Dashboards.
9. Save an existing custom Dashboard as a new Dashboard
Pro and Ultimate subscription plan users can reuse an existing editable Dashboard as the starting point for another Dashboard.
To save an existing custom Dashboard as a new Dashboard:
- Open a Dashboard.
- Make any desired Criteria, layout, or widget changes.
- Select Save as new Dashboard.
- Review the Dashboard Name.
- Select Save as new Dashboard.
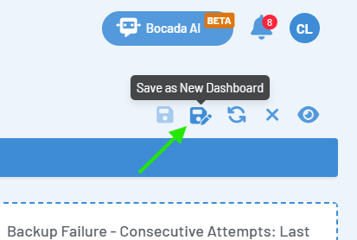
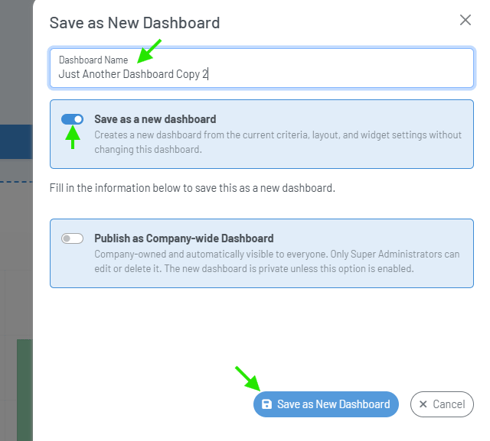
The new Dashboard includes the current:
- Criteria
- Layout
- Widget visibility
- Widget configuration
- Drill-down report selections
Creating a new Dashboard does not change the source Dashboard.
The new Dashboard is personal by default.
Ultimate subscription plan users with a Super Administrators role can optionally enable Publish as Company-wide Dashboard while creating the Dashboard. The published dashboard will be available to all users in your Bocada Cloud account
10. Edit Dashboard properties
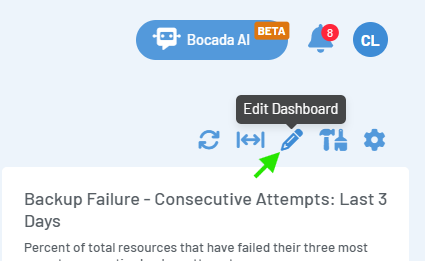
To change the properties of a custom Dashboard:
- Open the Dashboard.
- Click the Edit Dashboard icon (pencil graphic) from the Dashboard toolbar.
- Update the available properties.
- Select Save.
The Dashboard Properties drawer can be used to:
- Rename the Dashboard.
- Save the Dashboard as a new Dashboard.
- Publish or unpublish a Company-wide Dashboard when permitted.
- Delete a custom Dashboard.
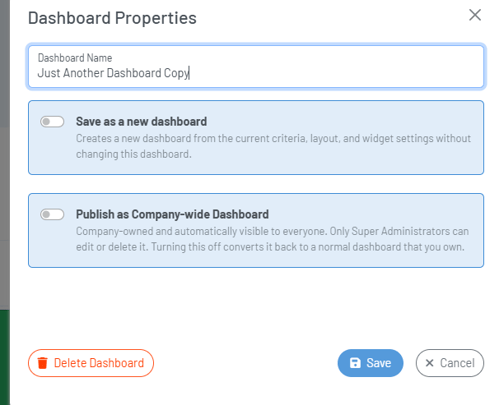
Note: The Bocada Main Dashboard cannot be deleted. Company-wide Dashboards can only be edited or deleted by an authorized Super Administrator.
11. Select your default Dashboard
You can choose which available Dashboard you will see by default when you log into Bocada Cloud.
To set your personal Dashboard default:
- Select your profile icon in the upper-right corner of Bocada Cloud.
- Select User Settings.
- Under General Preferences, locate Dashboard Defaults.
- Select a Dashboard from Default Dashboard.
- Select Save Dashboard Default.
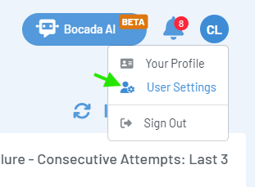
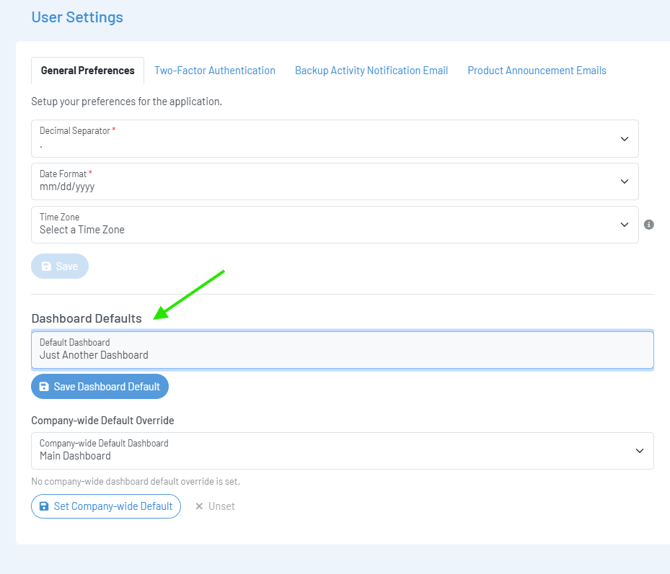
Your available selections can include the Main Dashboard, your personal Dashboards, and Company-wide Dashboards that are available to you.
12. Publish a Company-wide Dashboard
With the Ultimate subscription plan, a Super Administrator can publish a Dashboard company-wide, making it automatically available to all users in the Bocada Cloud account.
To publish a Company-wide Dashboard:
- Open the custom Dashboard you want to make available to all users.
- Click the Edit Dashboard icon (pencil graphic) from the Dashboard toolbar.
- In Dashboard Properties, enable Publish as Company-wide Dashboard.
- Select Save.
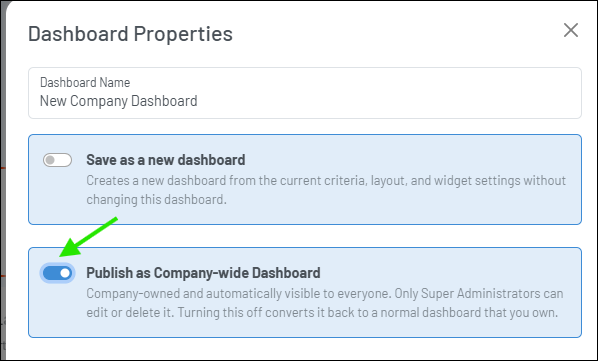
Only Super Administrators can edit or delete a Company-wide Dashboard.
Publishing a Dashboard does not overwrite users’ personal Dashboards automatically.
A Dashboard created using Save as New Dashboard is private unless Publish as Company-wide Dashboard is explicitly enabled.
Set a Company-wide default Dashboard
Ultimate plan Super Administrators can also set a Company-wide default Dashboard for all users to see when they log into Bocada Cloud.
To configure the Company-wide default Dashboard:
- Select your profile icon.
- Select User Settings.
- Under General Preferences, locate Dashboard Defaults.
- Under Company-wide Default Override, select the Dashboard to use.
- Select Set Company-wide Default.
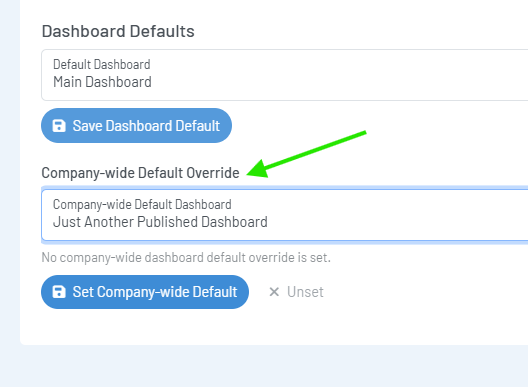
To remove the Company-wide default, select Unset.
Only users with the required Super Administrator permissions can configure the Company-wide default.
13a. Troubleshooting: What happened to Dashboard customizations created before this update?
If you previously configured and saved changes to the Main Dashboard before the new custom Dashboard functionality was released in August 2026, Bocada Cloud preserved that configuration.
Your existing configuration is migrated to a personal custom Dashboard named My Dashboard.
My Dashboard is then used as your personal Dashboard and can be edited or renamed, subject to your subscription plan and user permissions.
The Bocada Main Dashboard remains available separately as the standard Dashboard provided by Bocada.
13b. Troubleshooting: What should I check if I cannot edit or use a specific Dashboard configuration option?
If Dashboard configuration options are not available, confirm that:
- Your user role allows Dashboard editing.
- The feature you want to use is included with your subscription plan.
- You are not attempting to edit a read-only Company-wide Dashboard.
- You have access to the Organizations and reports required by the Dashboard configuration.
Viewers cannot configure Dashboard widgets, layouts, or personal Dashboards.
Some capabilities, such as showing or hiding widgets, require Pro or Ultimate subscription plans.
Custom drill-down reports require the Ultimate subscription plan.
Company-wide publishing and Company-wide default configuration require the Ultimate subscription plan.
If problems persist, create a Support Ticket in Bocada Cloud, or contact us.